Image Wisely, a joint initiative of ACR, RSNA, ASRT and AAPM,
provides information to the medical community to promote safety in medical imaging.

Tissue Attenuation of X-Rays
James R. Duncan MD, PhD; Saman Panahipour, MD, Mallinckrodt Institute of Radiology, St. Louis, MO
Published November 25, 2014 | Download PDF

Introduction
The automatic exposure control circuit in fluoroscopy units adjusts the intensity of the incident X-ray beam to achieve a predetermined set point which is typically 0.020-0.040 microGray for each fluoroscopic image and 1-4 microGray for each digital subtraction angiography (DSA) image. The intensity of the incident X-ray beam can be estimated from the reference point air kerma (Kar). The general relationship between the number of incident photons entering the patient’s skin and exiting photons reaching the detector is described by the Beer-Lambert Law.
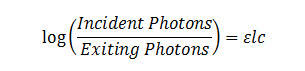
Where ε is the absorbance coefficient, c is the concentration of the absorbing substances and l is the path length through tissue. ε is the high for highly attenuating substances such as iodine, barium and metals. ε is the low for air and intermediate for fat and water.
In most tissues, the concentration of the absorbing substances is fixed but the concentration factor becomes important when administering contrast materials. A bladder filled with either a small amount of concentrated contrast material or a large amount of dilute contrast can markedly attenuate the beam. Large metallic objects such as spinal rods can also markedly attenuate the beam. Such attenuation can lead to 10–100 fold increases in the intensity of the incident X-ray beam in order to have sufficient photons reaching the detector.
The impact of patient thickness on X-ray penetration is dramatic. Small increases in tissue thickness cause large increases in the intensity of the incident X-ray beam. Again this is necessary to have sufficient photons reaching the detector to create useful images.
Table 1: Effect of patient thickness on X-ray penetration* |
|||
| Tissue Thickness (cm) | Number of Incident Photons Required to Have 1 Photon Reach Image Detector | Fraction of Incident Photons Absorbed or Scattered by Tissue | |
| 5 | 3 | 66% | |
| 10 | 10 | 90% | |
| 15 | 33 | 97% | |
| 20 | 100 | 99% | |
| 25 | 330 | 99.7% | |
| 30 | 1,000 | 99.9% | |
| 35 | 3,300 | >99.9% | |
| 40 | 10,000 | >>99.9% | |
*Assumes interaction of monoenergetic photons and tissue where the thickness of the half-value layer is approximately 3 cm. Since X-rays produced by fluoroscopy units contain photons with a wide range of energies, the lower energy photons tend to be absorbed or scattered by the patient and higher energy photons are more likely to reach the detector. Indeed, since low energy photons are unlikely to reach the detector, aluminum and copper filters are used to preferentially remove them from the beam before they reach the patient. An interactive simulation that models the attenuation of a polychromatic beam is available [1].
How Patient Thickness Dramatically Impacts Patient Dose
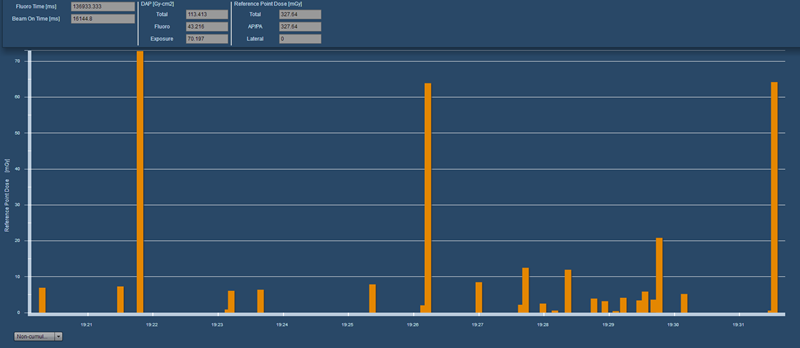
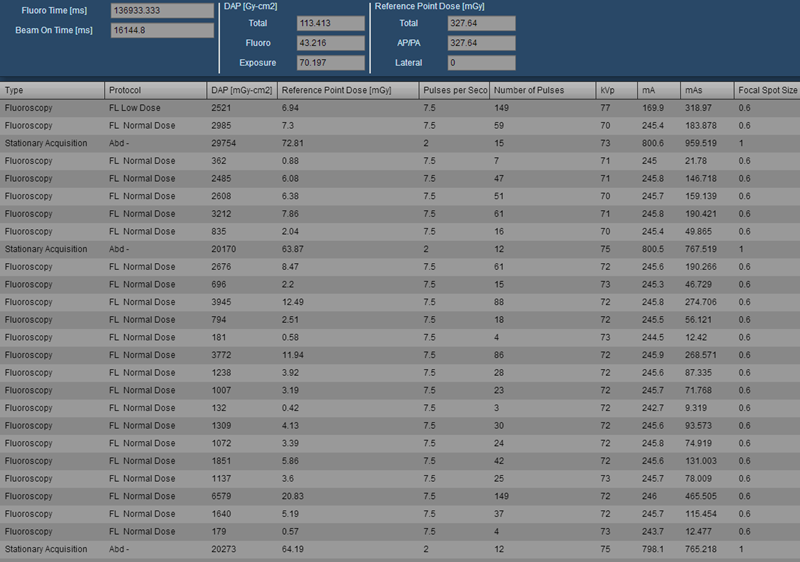
1. Higher Than Usual Ka,r During IVC Filter Placement*
The procedure timeline and event log reveal three separate DSA runs, each approximately 65–75 mGy. Each run was two frames per second and contained 12-15 frames. Images from the procedure and a subsequent abdominal CT scan show that patient had standard IVC anatomy and a large (36 cm) abdominal diameter. The DSA runs for the IVCgram were centered over L2. A retrievable filter was placed.
Figure 1: Higher than usual Ka,r during IVC filter placement
 |
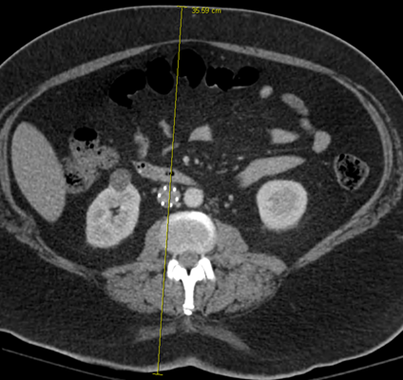 |
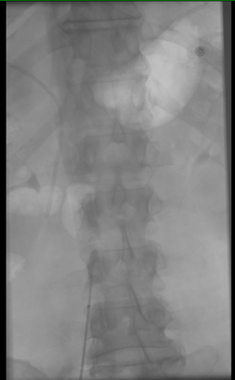
Figure 2: Representative images showing IVCgram and abdominal diameter at level of the IVC filter. Note that the IVC gram is well collimated. The collimation index (Pka/Kar) was calculated at 408 cm2 |
2. Contributing Factors for the Higher Than Usual Ka,r
- Large patient diameter
- Three separate DSA runs. It is a common practice to acquire two DSA sequences during placement of retrievable filters. The first is used to assess IVC anatomy and plan where the filter will be deployed. A final DSA sequence is often used to assess filter tilt or other factors that might complicate future retrieval of the filter. Severely tilted filters have been immediately retrieved and redeployed to minimize this issue. The reason for the additional DSA run prior to filter deployment is not clear from the available data. The table was moved between the first and second DSA runs and then remained stationary for the rest of the procedure.
*Notes
- Expected Ka,r value of 125mGy for IVC filter placement was determined using a control chart.
- Fluoroscopy time of 137 seconds is slightly below the mean value of 156 seconds and well below the upper control limit of 417 seconds. This suggests that the procedure was near average in terms of difficulty. This upper control limit was determined using a control chart.
- Procedure was started using low dose settings (FL Low Dose for fluoroscopy and Abd minus for Stationary Acquisitions). A higher setting (FL Normal Dose) was used for the majority of the procedure.
Lower Than Usual Ka,r During IVC Filter Placement
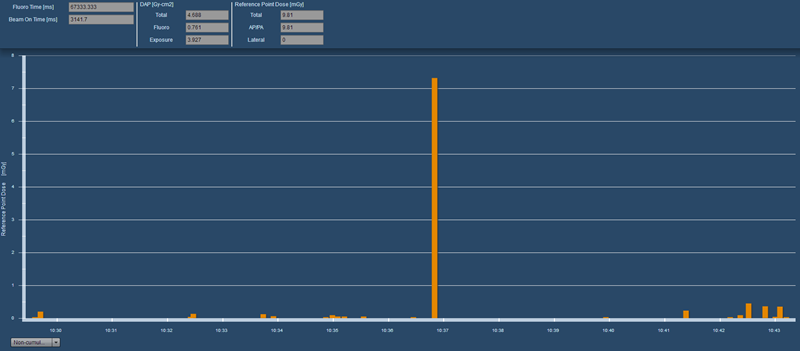
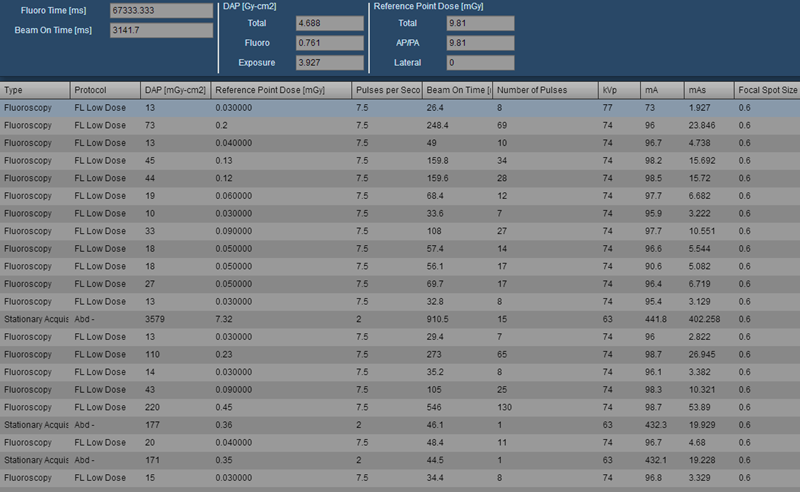
Procedure timeline and event log reveals one DSA run of 15 frames at two frames per second. This run resulted in 7.3 mGy. Two single image acquisitions were performed near the end of the procedure. A permanent filter was placed. Images from the procedure and a subsequent abdominal CT scan show that patient had standard IVC anatomy and a small (17 cm) abdominal diameter.
Figure 3: Lower than usual Ka,r during IVC filter placement
 |
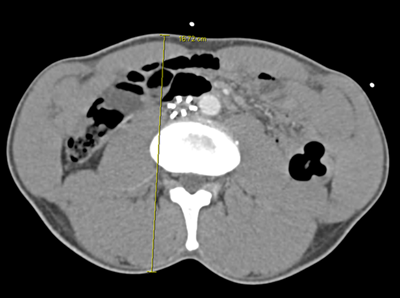 |
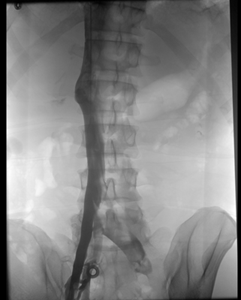
Figure 4: Representative images showing IVCgram and abdominal diameter at level of the IVC filter. Note that collimation during the IVCgram could have been improved. The collimation index (Pka/Kar) was calculated at 489 cm2 |
Contributing Factors to the Lower Than Usual Dose Metrics
- Small patient diameter
- Single DSA run. Many staff have ceased performing a second IVCgram after placing permanent filters. Rather, single frame acquisitions or saved fluoroscopy images are used to document filter location and configuration after deployment.
Notes
- Fluoroscopy time of 67 seconds is well less that the overall average of 147 seconds. This suggests that the procedure was less difficult than average.
- This procedure was performed entirely using low dose settings
- This procedure was performed in the same room and same month as the higher than usual IVC filter placement
Reference
- X-Ray interaction with matter and attenuation (Web app). Available at: http://xrayphysics.com/attenuation.html. Accessed September 24, 2014.
