Image Wisely, a joint initiative of ACR, RSNA, ASRT and AAPM,
provides information to the medical community to promote safety in medical imaging.

Image Quality Versus Utility
James R. Duncan, MD, PhD, Mallinckrodt Institute of Radiology, St. Louis, MO
David Tabriz, MD, University of Florida Shands Hospital, Gainesville, FL
Published November 25, 2014 | Download PDF

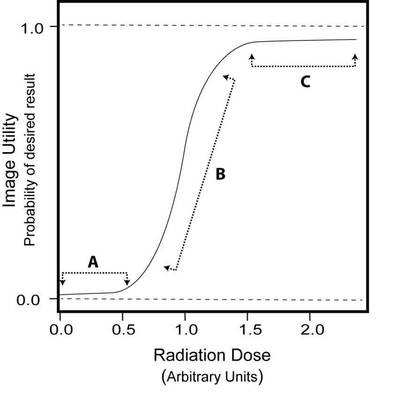
While traditional measures of image quality, such as signal-to-noise, increase steadily with radiation dose, image utility has a sigmoidal relationship [1]. At very low levels (Region A, Figure 1), the image does not contribute any meaningful information to the procedure, and thus it fails to improve the probability of a successful procedure. There remains a finite chance of success based on chance alone, but the image does not appreciably improve that chance. As image quality improves (Region B), it begins providing more and more information that leads to increases in the probability of success. However, these increases eventually reach a point of diminishing returns (Region C) where further increases in image quality have little or no impact on the result.
Figure 1: Impact of radiation dose on image utility
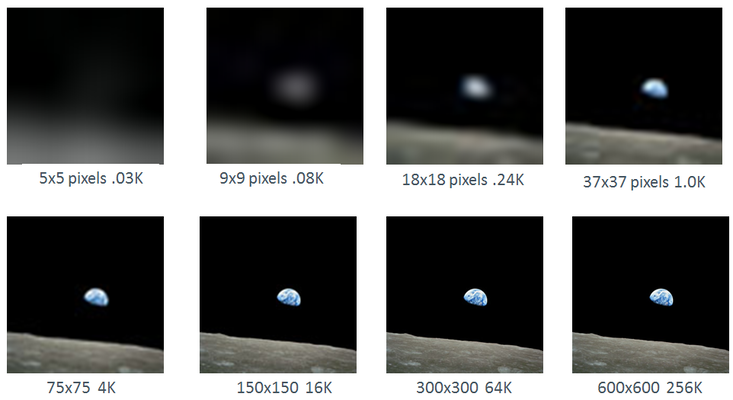
Resolution of an iconic image (Figure 2) was manipulated to illustrate this point. The first two panels (5x5 and 9x9 pixels respectively) fall into Region A. The next three panels (18x18 to 75x75 pixels) fall into Region B. Region C is represented by the final three panels.
Figure 2: Impact of manipulated resolution on an iconic image
Images from a fluoroscopic procedure help further illustrate this point (Figure 3). Two scout images were obtained prior to injecting the left upper quadrant drainage catheter. For Panel A, the automatic exposure control unit terminated the exposure when it received 2.4 microgray (µGy). After altering image centering and magnification, a second image was obtained after adjusting the exposure so it terminated after 0.24 µGy (Panel B). While Panel A has a noticeably higher signal-to-noise ratio that is best seen when examining details of the adjacent spine, Panel B depicts the tube position and adjacent anatomy in sufficient detail to serve as a scout image.
Figure 3: Scout images

Panel A — automatic exposure control unit terminated the exposure when it received 2.4 µGy.
Panel B — second image obtained after altering image centering and magnification and adjusting the exposure so it terminated after 0.24 µGy.
Reference
- Duncan JR, Evens RG, Using information to optimize medical outcomes. JAMA, 2009;301(22):2383-2385. Available at: http://jama.jamanetwork.com/article.aspx?articleid=184036. Accessed October 2, 2014.
