Image Wisely, a joint initiative of ACR, RSNA, ASRT and AAPM,
provides information to the medical community to promote safety in medical imaging.

Capture and Analysis of Radiation Metrics From Fluoroscopic Procedures
James Duncan, MD, PhD, Mallinckrodt Institute of Radiology, St. Louis, MO
Published November 25, 2014 | Download PDF

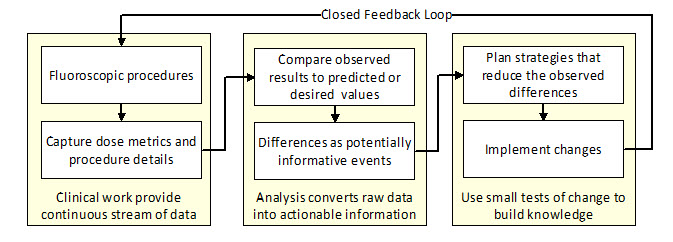
Improving radiation safety during fluoroscopic procedures requires a systematic approach where radiation metrics are routinely captured and analyzed and the results are used to determine if prior changes have led to improvement [1]. In this feedback loop, data is continually captured and analyzed.
Analysis uses a difference engine to calculate the difference between observed and predicted values of the various metrics. Substantial as well as systematic differences warrant an investigation to determine causal factors which might explain the difference [2]. The results are used not only to update the predicted values but also to suggest interventions that might lead to improvement. Repeating these cycles is the basis of continuous process improvement [3].
Figure 1: Continuous process improvement cycle
Like the underlying patient care systems, the resulting improvement system has internal processes that will evolve over time. The design of every component in this system aims to reduce the overall risks of these procedures while preserving their benefits.
Step 1: Capturing radiation metrics from every procedure
Several recent changes support the efficient and accurate capture of radiation metrics from fluoroscopic procedures. Newer fluoroscopy units record numerous dose metrics and record the values in a computer readable file [4]. These radiation dose structured reports (RDSRs) not only include the procedure’s total fluoroscopy time, kerma area product and reference point air kerma, but also include underlying factors such as imaging protocol, tube current, kVP, pulse duration, frame rate, field of view, imaging angles, table position and detector position. Commercially available dose monitoring systems collect these reports and store the data in databases.
Despite these advances, neither the RDSRs nor the dose monitoring systems routinely collect all the data needed to fully describe the factors that influence a procedure’s radiation use. Details of the procedure type, team performing the procedure, patient attributes and clinical history are not incorporated into the RDSR but could potentially be imported from other portions of the patient’s electronic medical record. Such information could include the procedure and diagnostic codes (CPT®, ICD-9 and ICD-10) used for billing purposes. Patient attributes such as size and anatomic factors could be extracted from the images themselves or an appropriately structured procedure report.
Step 2: Analyzing the data by finding large differences between observed and expected/desired
Data analysis can be viewed as the process of converting raw data into actionable information. One particularly effective analytic technique is to look for differences between observed and predicted values for various dose metrics.
Since numerous factors including patient size, operator skill, imaging protocols and difficulty of the clinical problem impact radiation use, predicted values are typically expressed as a range. Stated another way, it is fully expected that an intricate neurovascular intervention, difficult biliary drainage or complex percutaneous coronary intervention may require 10–30 minutes of fluoroscopy and results in Ka,r (reference point air kerma) of 1000–3000 mGy. Conversely, it is unexpected that a simple insertion of an inferior vena cava filter, diagnostic arteriogram or feeding tube placement requires 10–30 minutes of fluoroscopy and results in Ka,r of 1000–3000 mGy.
The more variable the underlying process, the more decisions are required to complete the procedure [5]. Since information gleaned from the fluoroscopic images is used to guide intraprocedural decisions, complex and variable procedures will tend to yield a larger expected range of dose metrics. One can begin to narrow the expected range by specifying the procedure in greater detail. As an example, when all other factors are held equal, bilateral percutaneous nephrostomy tube placements are expected to result in longer fluoroscopy times and higher Ka,r than unilateral procedures.
Calculating expected ranges of dose metrics for common exams: internal vs. external benchmarks
The Joint Commission will soon require every imaging facility to develop expected ranges for its common CT procedures. Sites must also have a process for investigating what factor may have led to an exam falling outside that expected range.
While fluoroscopic procedures are far more variable than CT studies, the same processes should be used to develop expected ranges and investigate cases that fall outside the expected range. A site’s prior results can be used to calculate the upper limit of the expected ranges for common fluoroscopic procedures.
While most sites will employ the 75th percentile used for calculating reference values, sites might also use tools from statistical process control to calculate upper control limits. Sites might also compare their results to external benchmarks such as those published by NCRP[6] or cited below [7,8].
Step 3: Planning improvement efforts and conducting small tests of change
Common explanations for large or systematic differences include imaging protocols, patient populations, procedure naming conventions or team skill. Single cases can be viewed as case-based learning opportunities. Case series with consistently higher than predicted/desired dose metrics warrant investigation for underlying factors such as imaging protocols or equipment calibration that warrant adjustment.
In the same way that CT protocols are being scrutinized for improvement opportunities, examination of fluoroscopy protocols can lead to changes in baseline settings and large and sustained reductions in Ka,r across a wide variety of procedures [9].
References
- Duncan JR, Balter S, Becker GJ, et al. Optimizing radiation use during fluoroscopic procedures: proceedings from a multidisciplinary consensus panel. JVIR, 2011. 22(4):425-429. Available at: http://www.jvir.org/article/S1051-0443(10)01173-5/fulltext. Accessed October 9, 2014.
- Provost LP, Murray SK. The health care data guide : learning from data for improvement. 1st ed. San Francisco, CA: Jossey-Bass; 2011. Available at: http://www.wiley.com/WileyCDA/WileyTitle/productCd-0470902582.html.
- Langley GJ, Moen R, Nolan KM, Nolan TW, Norman CL, Provost LP. The improvement guide: a practical approach to enhancing organizational performance. 2nd ed. San Francisco: Jossey-Bass; 2009. Available at: http://www.wiley.com/WileyCDA/WileyTitle/productCd-0470192410.html.
- Balter S, Blendinger H. DICOM Dose: Capture and reporting. World congress on medical physics and biomedical engineering: radiation oncology. IFMBE Proceedings 25/3;2009. 1st ed. New York: Springer. Available at: http://link.springer.com/chapter/10.1007/978-3-642-03902-7_21#page-1. Accessed October 9, 2014.
- Beta E, Parikh AS, Street M, Duncan JR. Capture and analysis of data from image-guided procedures. JVIR, 2009. 20(6):769-781. Available at: http://www.jvir.org/article/S1051-0443(09)00221-8/fulltext. Accessed October 14, 2014.
- NCRP Report No. 172. Reference levels and achievable doses in medical and dental imaging: recommendations for the United States. National Council on Radiation Protection and Measurements; 2012. Available at: https://ncrponline.org/publications/reports/ncrp-report-172/. Accessed February 4, 2022.
- Miller DL, Kwon D, Bonavia GH. Reference levels for patient radiation doses in interventional radiology: proposed initial values for U.S. practice. Radiology, 2009. 253(3):753-764. Available at: http://pubs.rsna.org/doi/full/10.1148/radiol.2533090354. Accessed October 10, 2014.
- Storm ES, Miller DL, Hoover LJ, Georgia JD, Bivens T. Radiation doses from venous access procedures. Radiology, 2006. 238(3):1044-1050. Available at: http://pubs.rsna.org/doi/full/10.1148/radiol.2382042070. Accessed October 10, 2014.
- Duncan JR, Street M, Strother M, Picus D. Optimizing radiation use during fluoroscopic procedures: a quality and safety improvement project. JACR, 2013. 10(11):847-853. Available at: http://www.jacr.org/article/S1546-1440(13)00281-0/fulltext. Accessed October 10, 2014.
