Image Wisely, a joint initiative of ACR, RSNA, ASRT and AAPM,
provides information to the medical community to promote safety in medical imaging.

Using Control Charts to Monitor Radiation Metrics
James Duncan, MD, PhD; Saman Panahipour, MD, Mallinckrodt Institute of Radiology, St. Louis, MO
Published November 25, 2014 | Download PDF

After implementing processes that routinely collect radiation metrics from fluoroscopic procedures, one desires tools that simplify analysis of the resulting large and continually expanding dataset. One can wait for events to occur, investigate the circumstances and address the causal factors. For events like skin injuries from fluoroscopic procedures, this approach is rarely justified. Better is a proactive approach where one develops an understanding of the underlying system and uses that knowledge to identify issues before they cause injury. The result is a system that continually monitors performance and finds opportunities for improvement. This proactive approach is built upon Failure Mode and Effects Analysis (FMEA) [1,2]. FMEA acknowledges that while untoward events can never be completely prevented, steps can be taken to reduce event frequency, minimize severity when the unintended events inevitably occur and improve early detection so there is sufficient time to take corrective action before a minor event escalates into a major catastrophe.
Graphs are powerful tools that not only support rapid analysis of large datasets but can also reveal informative patterns. Given that data is continually added over time, graphs of the dose metrics versus date are a simple first step in data analysis. These graphs reveal past patterns and an understanding of what caused those patterns can be used to influence future performance (Figures 1 and 2).
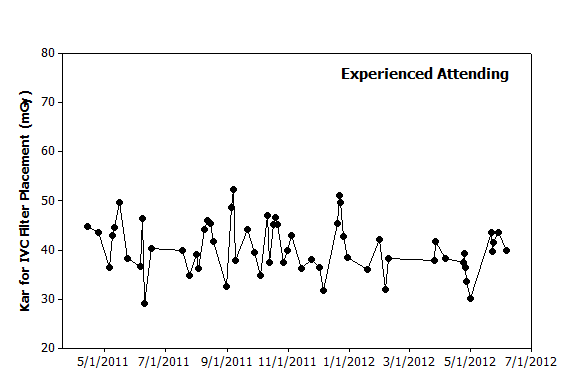 |
Figure 1. Graphical analysis. Hypothetical data from 60 IVC filter placements performed over 14 months by an experienced attending illustrates day-to-day variation. While no clear pattern is observed to explain this variation, one could use this graph to predict that filter placements in the coming months will likely yield dose metrics of 30–50 mGy. |
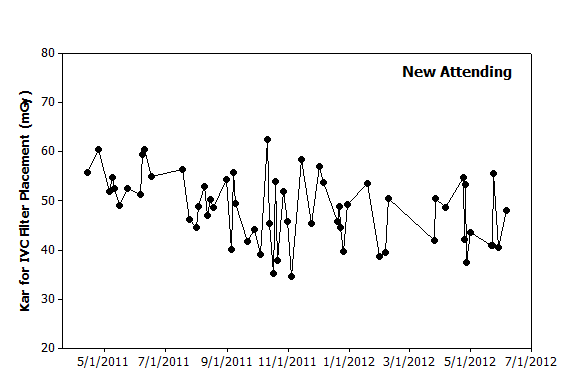 |
Figure 2. Graphical analysis. Hypothetical data from a new attending over the same period also illustrates day-to-day variation. The initial several procedures appear to have higher values than seen later. However, the highest value occurs in October 2011 and is followed shortly thereafter by the lowest value. Based on this data, filter placements in the coming months will likely have dose metrics of between 30–60 mGy. |
These simple graphs can be improved by adding tools that help detect more subtle patterns. Control charts are designed to help one distinguish between random and nonrandom variation [3,4]. Random variation influences the observed results of any “real world” process and attempts to improve performance by adjusting parameters in response to random variation will only further degrade overall performance [5]. In contrast, nonrandom variation in the observed dose metrics suggests that an underlying cause is influencing system performance. Possible causes are illustrated in the cause and effect diagram and such factors are valid targets for improvement efforts. Stated another way, detection of nonrandom variation is an informative event that should trigger an investigation into what factors caused the deviation from prediction. In some cases, the deviation will be observed with a single procedure. In other cases, the deviation will only be observed when examining a series of procedures (Figures 3 and 4).
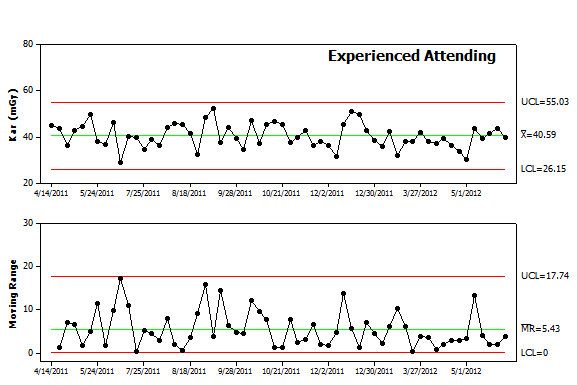 Figure 3. Control chart analysis. The data from Figure 1 was re-plotted as an Individual-Moving Range (I-MR) control chart. The chart includes the individual values in the upper panel and difference from procedure to procedure in the lower panel. Each panel includes the mean value as a center line as well as control limits. Future values are expected to fall above and below the center line in a random pattern and remain within the control limits for each panel. |
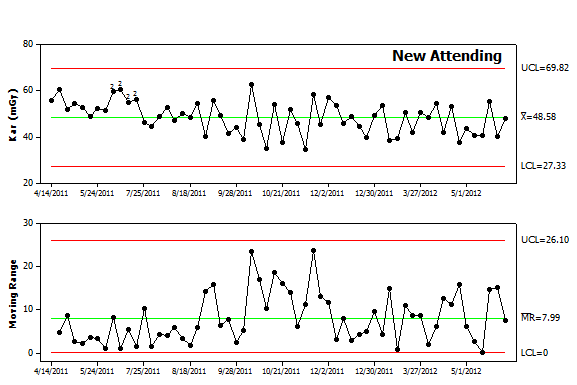 Figure 4. Control chart analysis. The data from Figure 2 was replotted as an I-MR control chart. The chart reveals a higher average value (Kar of 48.6) as well as more variability (average moving range of 8). The upper and lower control limits are also broader indicating that future values are less predictable. In addition, the chart contains a series of points in the upper panel label that are highlighted by “2”. The software used to create the chart runs a series of tests to detect nonrandom variation and found that the early data points failed the second test. The first twelve points all fall above the center line. While 2, 3 or even 8 consecutive points falling above center line can result from random variation, it is highly unusual to have 9 points above the center line and even less likely to have 12 consecutive points above the center line. This pattern warrants an investigation to determine causal factors. Given that these were the first IVC filter placements performed by this new attending, lack of experience is a possible cause. While some might contend this reflects a lack of skill, one should recall that this new attending likely trained with fluoroscopy units from a different manufacturer, different types of filters and different coworkers. By analogy, while most people consider themselves to be skilled pedestrians, cabdrivers in London have learned from experience that tourists often behave like confused children when crossing the street since they tend not to look both ways. |
When working with data emanating from ongoing processes like patient care, control charts are preferred over other statistical tools such as t-tests. As shown above, control charts are designed to detect patterns that reside in the data’s sequence. Control chart analysis will also detect single cases where the observed result should be investigated for a nonrandom cause (Figures 4 and 5).
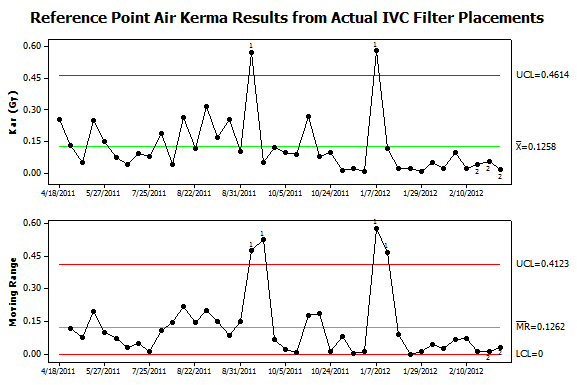 Figure 5. Control chart analysis of data from patient procedures. Dose metrics were collected from all procedures in the author’s practice using Structured Radiation Dose Reports. This data was matched with information extracted from the Radiology Information System (RIS). IVC filter placements were identified by their CPT® codes and the results plotted using an I-MR control chart. Two types of nonrandom variation were found in the upper panel. Two procedures failed to exceed the upper control limit for Kar and thus failed test #1. These outliers also caused the peaks in moving range (lower panel). In addition, a series of twelve consecutive procedures in January to February 2011 fell below the center line and thus failed test #2. This sequence of lower than expected values was associated with a sequence with lower than expected variation that led to failing test #2 in the lower panel. Investigation into possible causes found that new low-dose imaging protocols became the default setting in September 2011 and this led to the long sequence of lower Kar values. While the September 2011 high-dose case occurred after the protocol change, review of the images from the procedure found that the patient had a substantial amount of spinal hardware and this prompted the operators to perform the filter placement in a steeply angulated projection where the patient’s body diameter exceeded 40cm. Reviewing the circumstances of the January 2012 high-dose case found that a large pelvic mass made infrarenal filter placement problematic. A retrievable filter was placed but was sufficiently tilted that it was immediately retrieved and then redeployed in the suprarenal IVC.
|
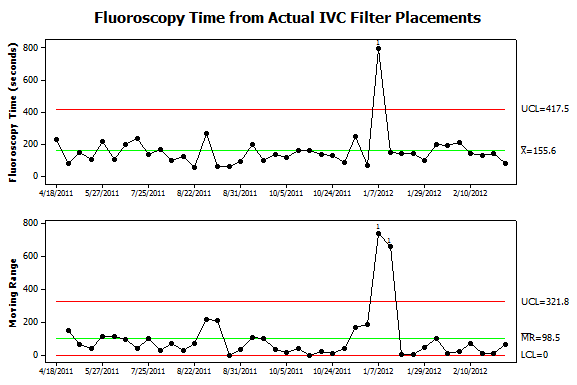 Figure 6. Further analysis of data from patient procedures. Fluoroscopy times were collected from the same procedures shown in Figure 5. Now only one instance of nonrandom variation is detected. It corresponds to the procedure where the filter was deployed, immediately retrieved and then redeployed in the suprarenal IVC. The additional steps not only caused an increase in Kar but also fluoroscopy time. Interestingly, the September 2011 case which required steeply angled views of the abdomen was not associated with an increase in fluoroscopy time. Also, the sequence of 12 low-dose filter placements had roughly the same fluoroscopy time as prior procedures. |
Summary
Multiple types of control charts are available and other sources describe in detail the process for choosing the different types [3]. The important point is awareness of the tools available to help analyze data gathered from an ongoing process. Control charts are designed to signal individual procedures or sequences of procedures where the observed results should be attributed to causal factors rather than random variation. The subsequent investigations then aim to identify the causal factors and better understand how they influence the observed results. That knowledge can then be used to not only improve our predictive models but also the underlying system.
References
- Duncan JR. Strategies for improving safety and quality in interventional radiology. J Vasc Interv Radiol. Jan 2008;19(1):3-7. Available at: http://www.jvir.org/article/S1051-0443(07)01327-9/fulltext. Accessed October 1, 2014.
- Stamatis DH. Failure Mode and Effect Analysis: FMEA from Theory to Execution. Second ed. Milwaukee, WI: American Society for Quality, Quality Press; 2003. Available at: http://asq.org/quality-press/display-item/?item=H1188. Accessed October 1, 2014.
- Provost LP, Murray SK. The health care data guide : learning from data for improvement. 1st ed. San Francisco, CA: Jossey-Bass; 2011. Available at: http://books.google.com/books/about/The_Health_Care_Data_Guide.html?id=pRLcaOkswQsC. Accessed October 1, 2014.
- Cheung YY, Jung B, Sohn JH, Ogrinc G. Quality initiatives: statistical control charts: simplifying the analysis of data for quality improvement. Radiographics. Nov-Dec 2012;32(7):2113-2126. Available at: http://pubs.rsna.org/doi/full/10.1148/rg.327125713. Accessed October 1, 2014.
- Deming WE. The new economics for industry, government, education. 2nd ed. Cambridge, MA: Massachusetts Institute of Technology, Center for Advanced Engineering Study; 1994.
